
There are a lot of Inventory Reports and Sales Reports in Counterpoint, but only a few combine sales and inventory data into one report, and only the Merchandise Analysis report allows you to pick and choose which data you want to see on the report. This report is a great tool for understanding your inventory.
Formatting Options of the Report
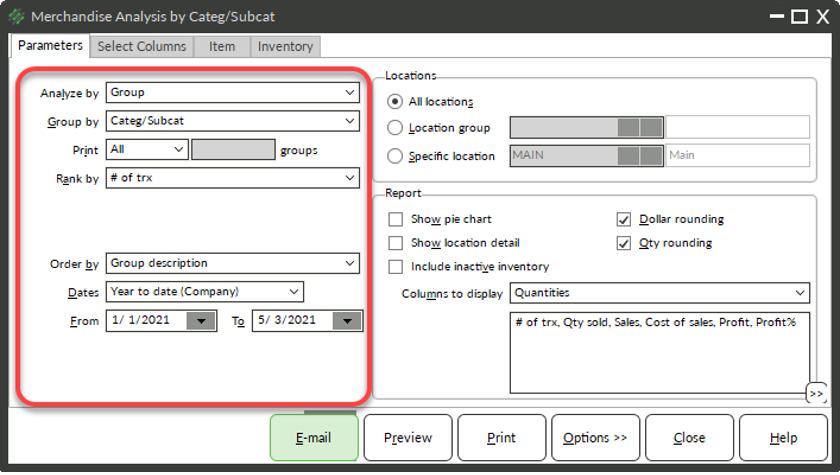
There are a few drop-down options on the parameters tab that will allow you to change how the report is shown.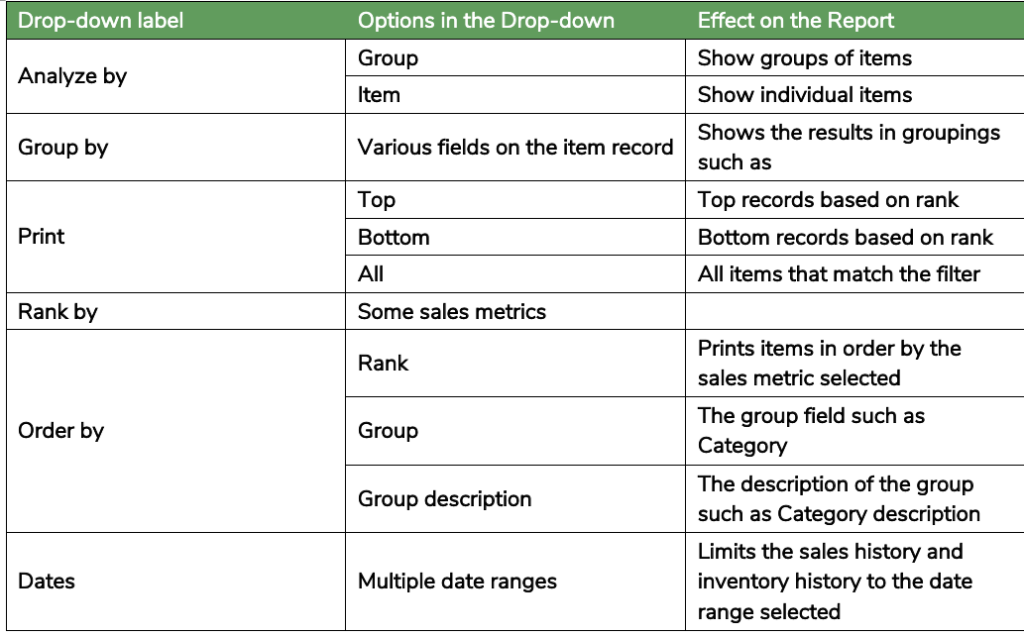
Location Filters
Use the Location box to limit which location(s) should be included in the report.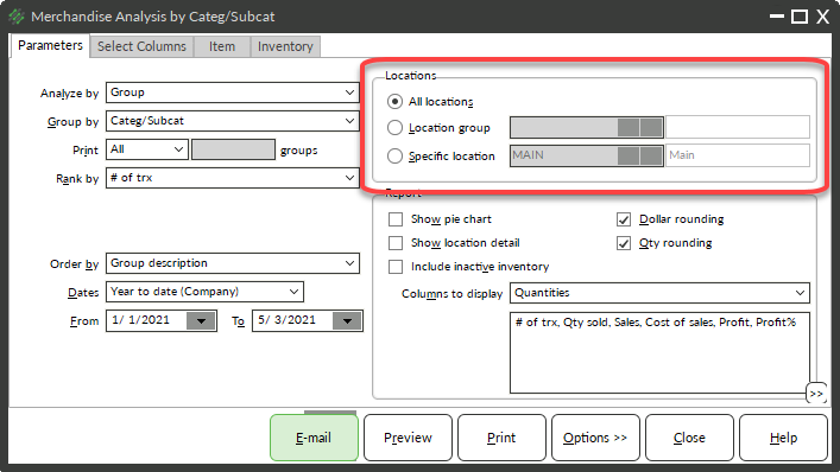
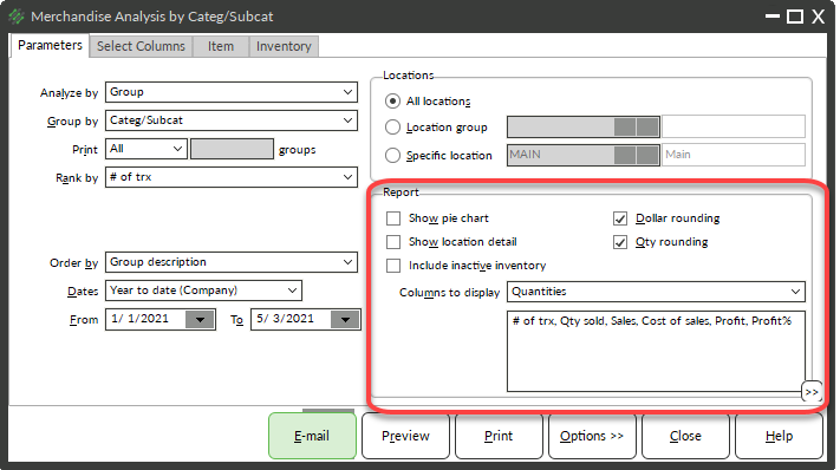
Report Settings
Use the report settings area to:
- Choose whether to print a pie chart
- Show details based on location
- Show items in the report that are marked inactive
- Round dollar or quantities
- Use a pre-defined group of columns for the report (you can also choose your own columns by using the Select columns tab)
Choosing Columns for the Report
If the columns to display drop-down does not have the columns that you would like to print:
- Click the Select Columns tab
- Move up to 10 columns to the Visible Columns area
- Select a column in the Available columns area and click the > button to move a column to the Visible columns area
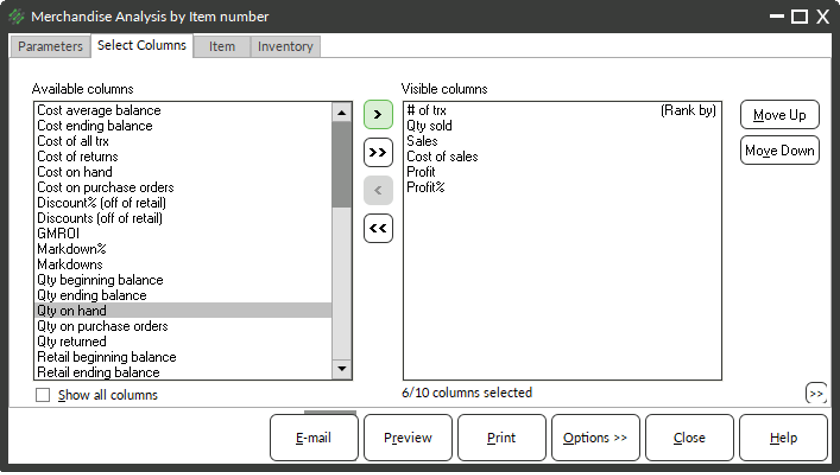
- Select a column in the Visible columns area and click the < button to remove a column from the Visible columns area
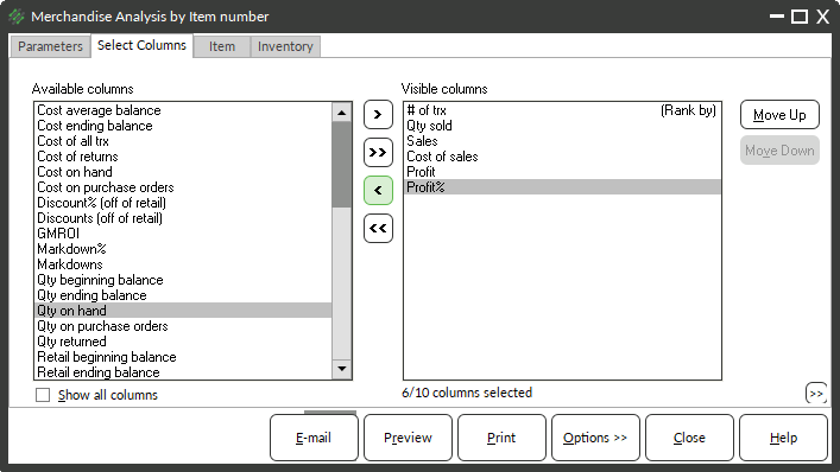
- (Optional) Use the Move Up or Move Down buttons to change the order of the columns
- (Optional) Use the Item or Inventory tabs to use filters to limit which items print on the report
- Click Preview


