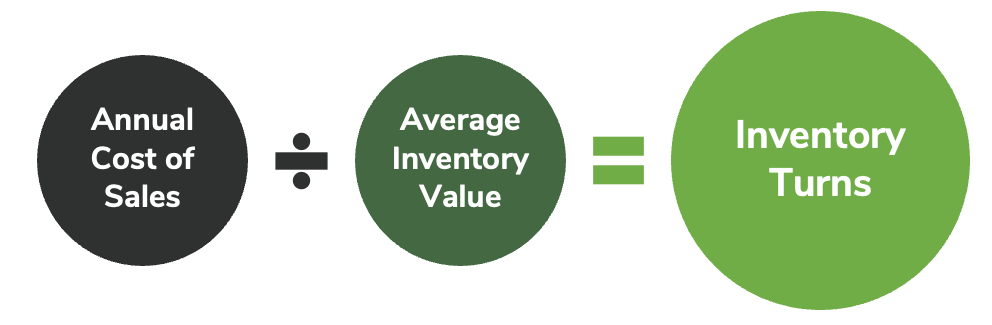
How are Inventory Turns Calculated?
Inventory turns measures the number of times throughout the year that you sell the average value of your inventory, or how many times your inventory turns over.
To calculate the inventory turns:
Why is Inventory Turns Important?
You can use inventory turns reporting to:
- Monitor for overstock – low number of turns might mean too much inventory
- Monitor for understock – high number of turns might mean you are not ordering enough and might miss sales
- Deficiencies in product lines – low number of turns might mean inventory is not high quality
Reporting on Inventory Turns
Inventory Turns by Category
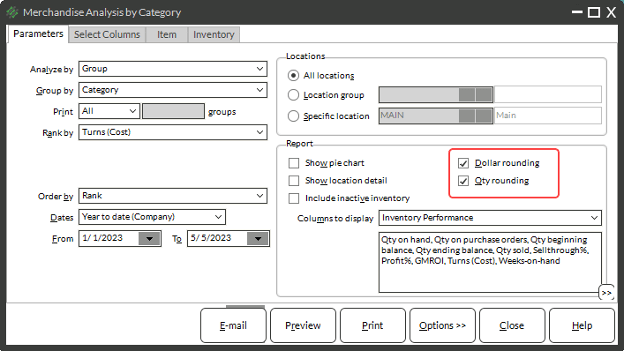
To report on Inventory Turns by Category:
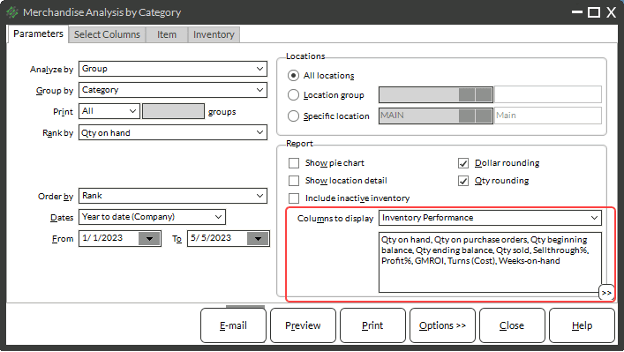
- Select Inventory → Reports → Merchandise Analysis
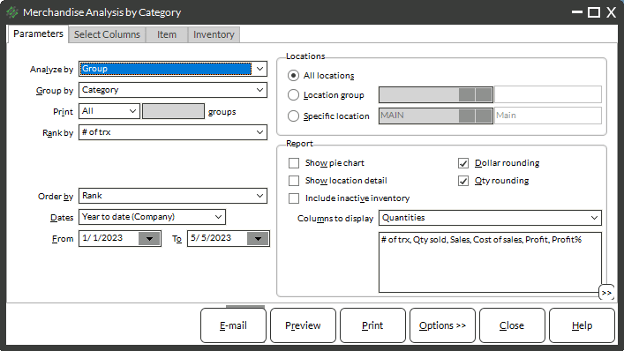
- Choose Group from the Analyze by drop-down
- Pick Category from the Group by drop-down NOTE: You could also choose another Group by method like Vendor if you prefer to report on inventory turns by another metric.
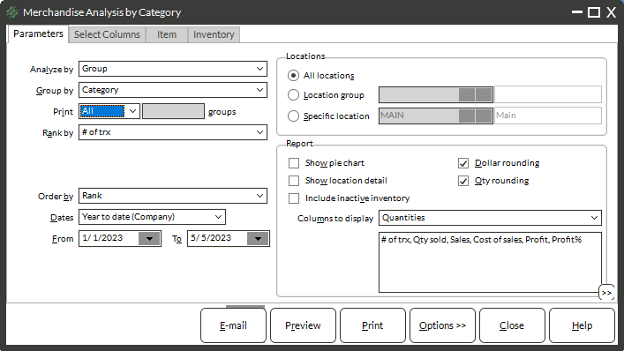
- Choose a number of records to report on from the Print filter
- In the report box, choose a Columns to display option. In this case, it is recommended to use either Inventory Performance or create a custom list of fields to display using the Select Columns tab.
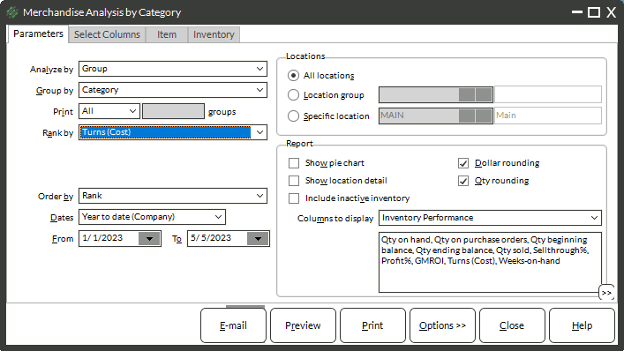
- Choose a Rank by Method
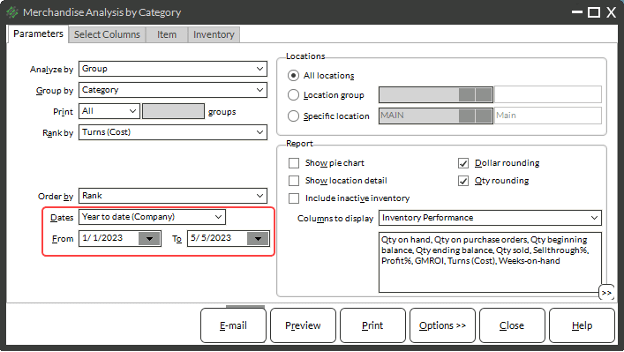
- Choose a Date Range for the report
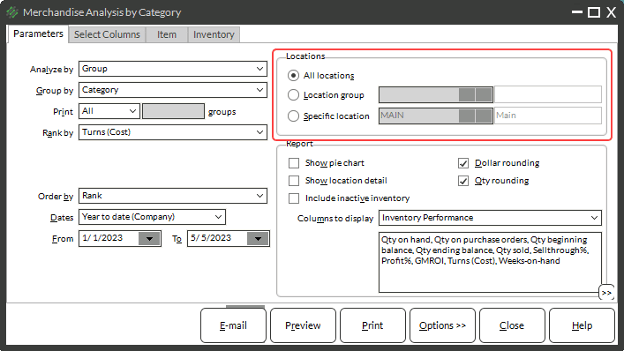
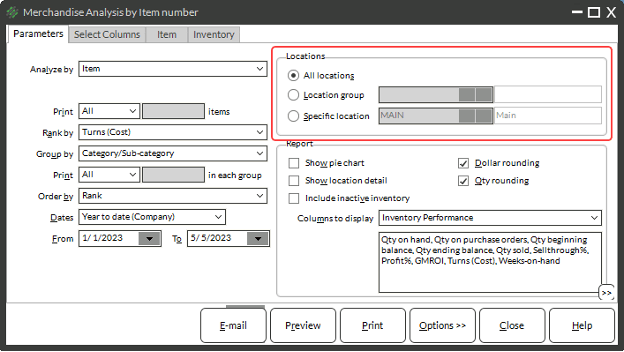
- Choose a location option
- (Optional) Check the box for Show Pie Chart
- Uncheck the checkboxes for Dollar rounding and Qty rounding
- (Optional) Use the Select Columns tab to add or remove data point for the report
- (Optional) Use the Item and Inventory reports to filter the report
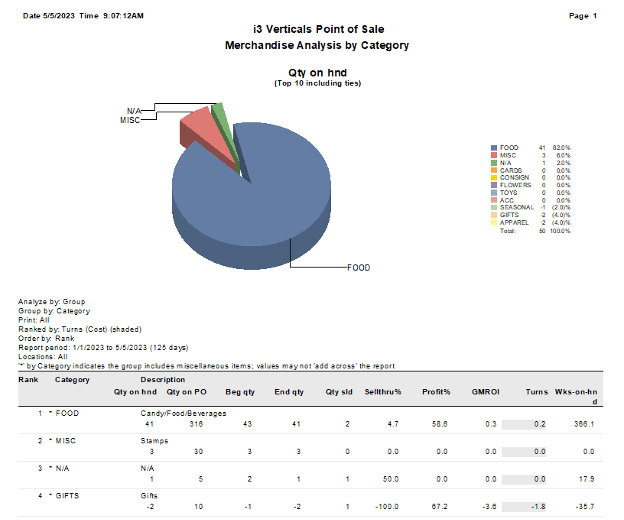
- Click Preview
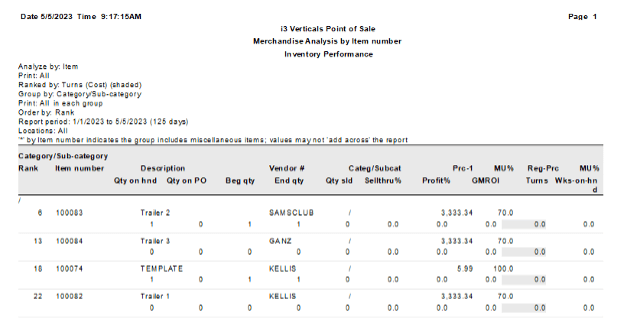
Inventory Turns by Item
To report on Inventory Turns by Item:
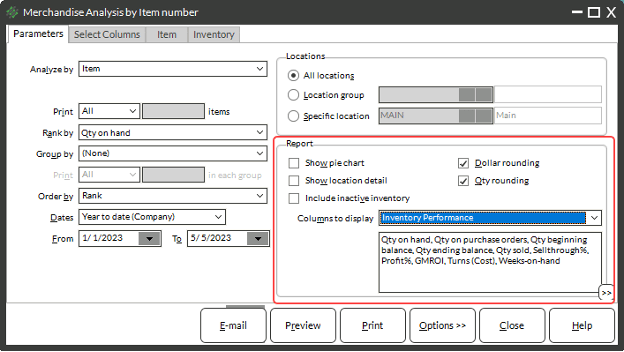
- Select Inventory → Reports → Merchandise Analysis
- Choose Item from the Analyze by drop-down
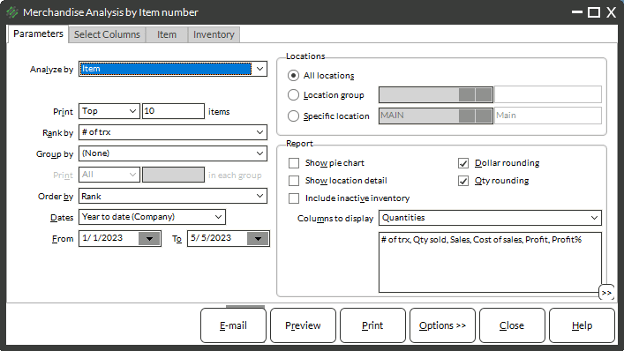
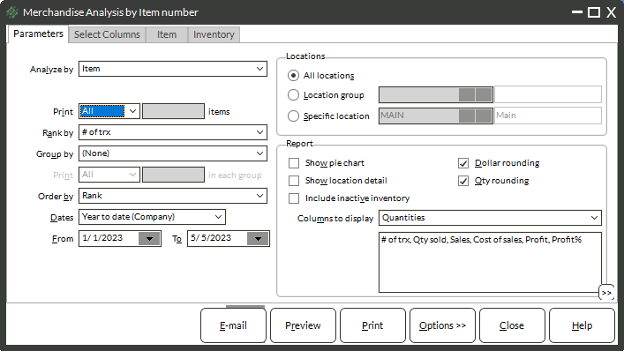
- Choose the number of records to print
- In the report box, choose a Columns to display option. In this case, it is recommended to use either Inventory Performance or create a custom list of fields to display using the Select Columns tab.
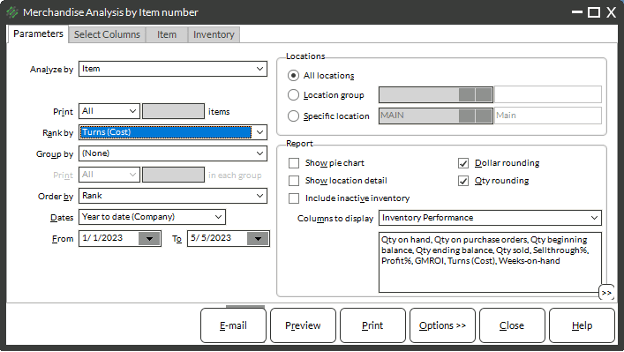
- Choose a Rank by method
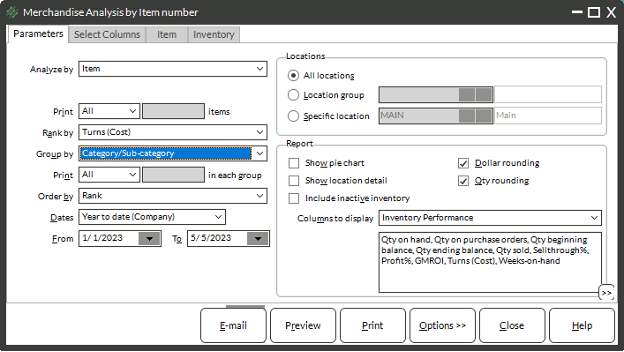
- Choose a Group by method
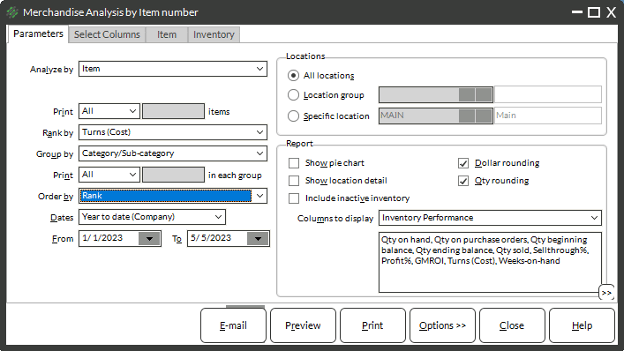
- Choose an Order by method
- Choose a Date Range
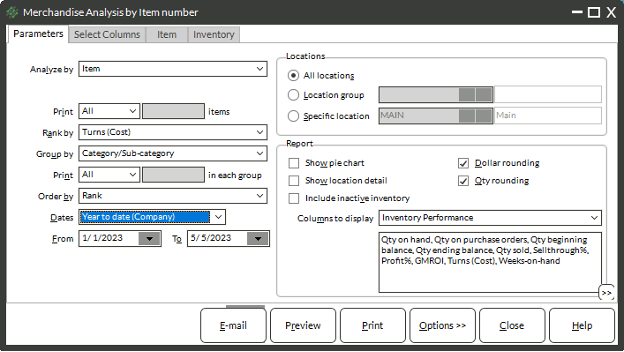
- Choose a location or locations
- Uncheck the box for Dollar rounding and Qty rounding
- (Optional) Use the Select Columns tab to add or remove data points from the report
- (Optional) Use the Item and Inventory tabs to filter the report
- Click Preview